The graphs above depict my predictions on how far a skateboard travels in a certain amount of time on a 21 in, 14 in, and 7 inch ramp in Mr. Kelly's driveway. The blue lines are my predictions and the black lines are the actual measurements plotted on the graph.
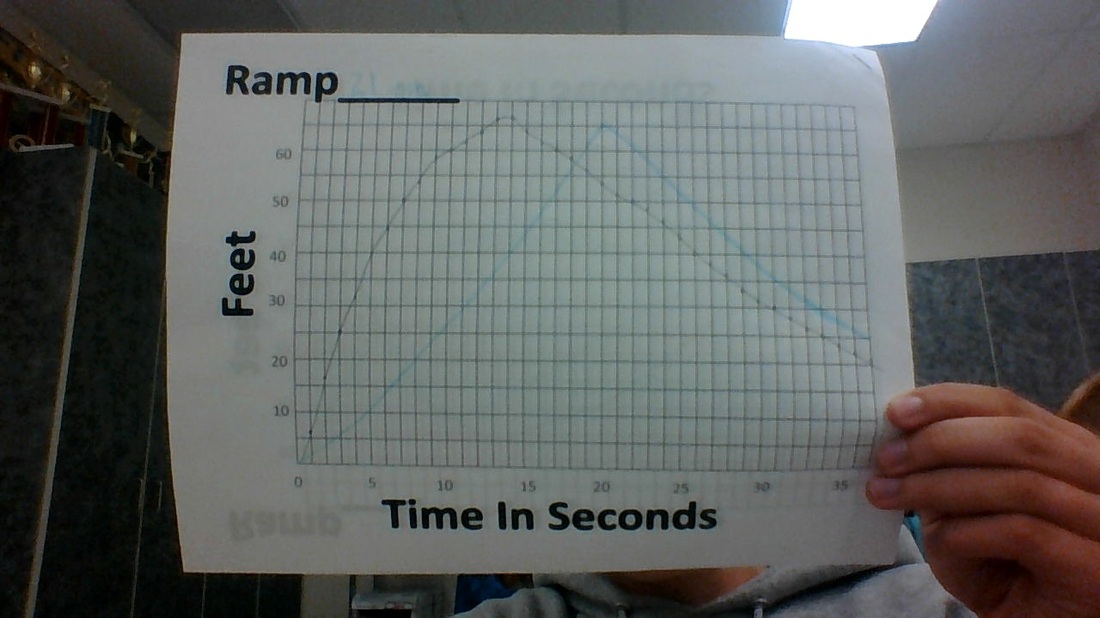
For the 21 inch ramp, which is the top picture, my prediction was not very accurate at all because I was not sure what to expect. I had it increasing slower over a longer span of time than the skateboard actually did. The range of the graph was [0,64] and the domain was [0,36].
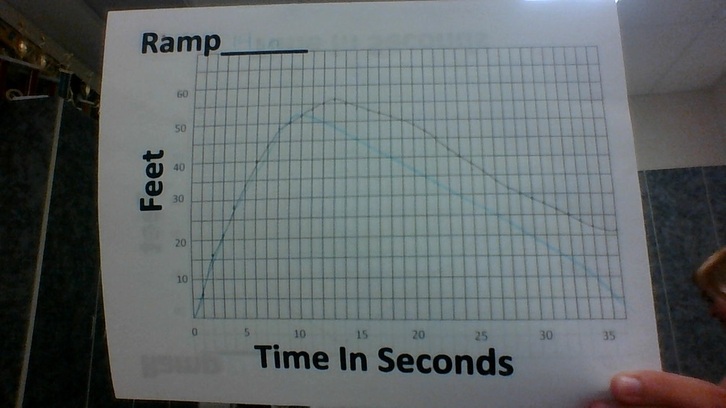
For the 14 inch ramp, I was much more accurate in my prediction because I used my knowledge from the last graph to guide me. I also had to take into account that the skateboard would not travel as far or as fast as the first one. The range of this graph was [0,56] and the domain was [0,37].
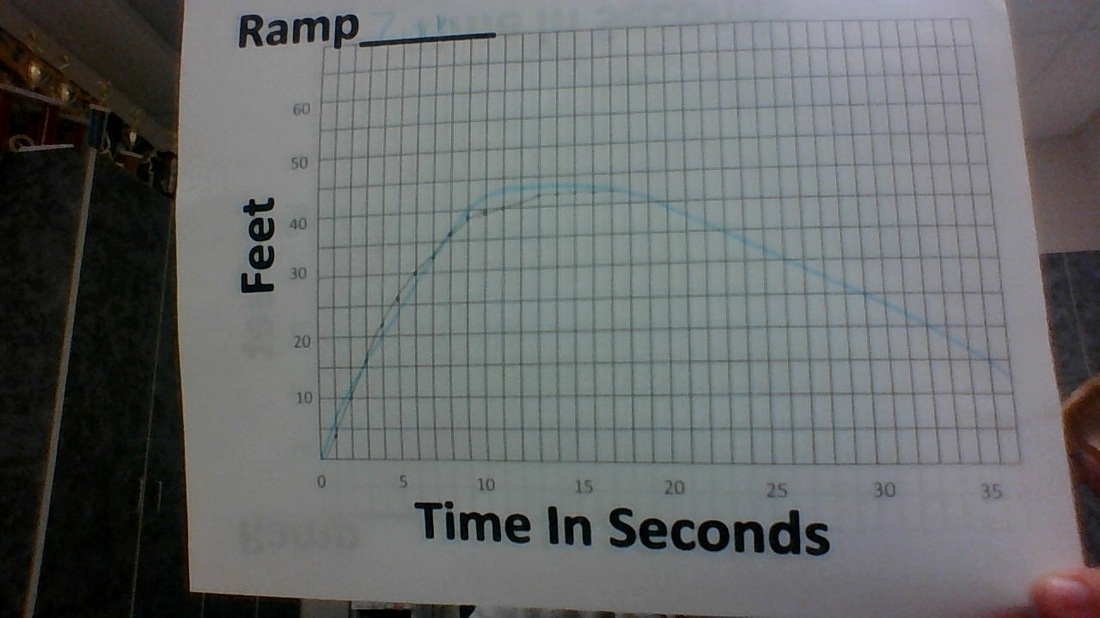
Lastly, the 7 inch graph was my most accurate prediction because I payed close attention to the farthest distance the skateboard went, and how long it took it to get there. Like the previous graph, I took into account that it would not travel as far and definitely not as fast. The domain was [0,42] and the range of the graph was [0,17]. My biggest problem with this graph was the fact that the skateboard did not roll backwards like the others did.
Each graph started at zero so they had the same minimum, yet they all had different maximums and times. When the skateboard first goes down the ramp is when all the graphs are the most similar with slight variations because of their respective ramp height. The steeper the ramp, the faster and longer the skateboard travels. This is why the graphs differ and why they are similar in the beginning.
The graphs rose the fastest when they first came off the ramp because they had the most momentum when coming off the ramp. Therefore, the higher the ramp, the faster the skateboard traveled. Unlike when the graph rose, they began to fall at a much slower rate. After a few seconds though, they were able to gain more momentum between the seconds of 17 to 25 and roll backwards down Mr. Kelly's driveway because it is sloped downward.
For the 21 inch ramp, which is the top picture, my prediction was not very accurate at all because I was not sure what to expect. I had it increasing slower over a longer span of time than the skateboard actually did. The range of the graph was [0,64] and the domain was [0,36].
For the 14 inch ramp, I was much more accurate in my prediction because I used my knowledge from the last graph to guide me. I also had to take into account that the skateboard would not travel as far or as fast as the first one. The range of this graph was [0,56] and the domain was [0,37].
Lastly, the 7 inch graph was my most accurate prediction because I payed close attention to the farthest distance the skateboard went, and how long it took it to get there. Like the previous graph, I took into account that it would not travel as far and definitely not as fast. The domain was [0,42] and the range of the graph was [0,17]. My biggest problem with this graph was the fact that the skateboard did not roll backwards like the others did.
Each graph started at zero so they had the same minimum, yet they all had different maximums and times. When the skateboard first goes down the ramp is when all the graphs are the most similar with slight variations because of their respective ramp height. The steeper the ramp, the faster and longer the skateboard travels. This is why the graphs differ and why they are similar in the beginning.
The graphs rose the fastest when they first came off the ramp because they had the most momentum when coming off the ramp. Therefore, the higher the ramp, the faster the skateboard traveled. Unlike when the graph rose, they began to fall at a much slower rate. After a few seconds though, they were able to gain more momentum between the seconds of 17 to 25 and roll backwards down Mr. Kelly's driveway because it is sloped downward.